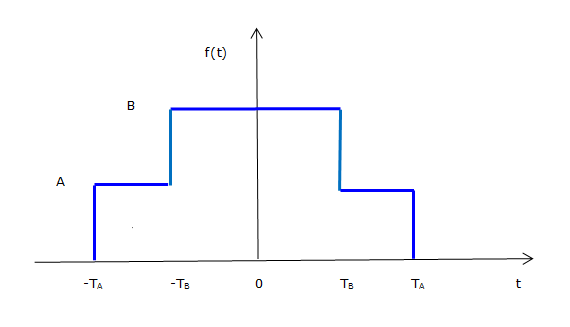
Consider the f(t) in the graph that follows:
It is defined in such way that the values of parameters
A,
B,
T_{A} and
T_{B} must be defined.
The objective of this object is to observe how the graphic representation of the Fourier Transform of
f(t) varies when the values of parameters
A,
B,
T_{A} and
T_{B} are changed. You can simultaneously plot the Transforms for three different sets of parameters.