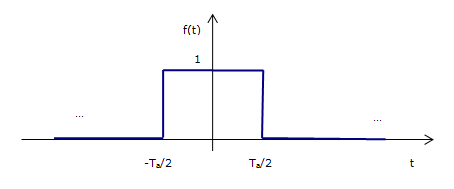
Consider the unit pulse centered at the origin as shown in the figure that follows:
The function was defined with a variable with
T_{a}. It can be expressed as:
The objective of this simulation is to observe the different shapes of the graphic of the Fourier Transform of this function for different values of
T_{a}. It allows the graphics for three different values of
T_{a} to be displayed at the same time. The maximum value allowed for Ta is 24.5.