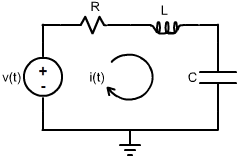
Consider the
RLC circuit of the figure below:
This circuit may be used as a second order filter. According to the element where the output is measured, the inductor, the resistor or the capacitor, it is a high-pass (HP), a band-pass (BP) or a low-pass (LP) filter.
When the output is in the inductor (HP) the transfer function is:
H(s)_{PA} = \frac{s^2}{s^2 + \frac{R}{L} s + \frac{1}{LC}}
a) Analyze the Bode Plot of this high-pass filter for different values of
R and/or
L and/or
C.
When the output is in the resistor (BP) the transfer function is:
H(s)_{PBD} = \frac{\frac{R}{L} s}{s^2 + \frac{R}{L} s + \frac{1}{LC}}
b) Analyze the Bode Plot of this band-pass filter for different values of
R and/or
L and/or
C.
When the output is in the capacitor (LP) the transfer function is:
H(s)_{PBX} = \frac{\frac{1}{LC}}{s^2 + \frac{R}{L} s + \frac{1}{LC}}
c) Analyze the Bode Plot of this low-pass filter for different values of
R and/or
L and/or
C.