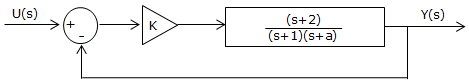
Consider the system represented by the block diagram:
Choose different values of ‘a’, both positive and negative, and observe their effects in the Root Locus Plot. Then, determine the maximum values of K for the system to be stable when a = -1 and a = -5.
Observe that this exercise refers to the same system of exercise 2 in the Nyquist Stability Criterion Simulator Object. Compare the results obtained using both methods.