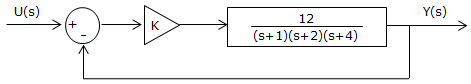
Consider the system represented by the block diagram:
Use the Root Locus Plot to determine the point at which the system becomes unstable and compute the corresponding value of K. Observe that this exercise refers to the same system of exercise 1 in the Nyquist Stability Criterion Simulator Object. Compare the results obtained using both methods.