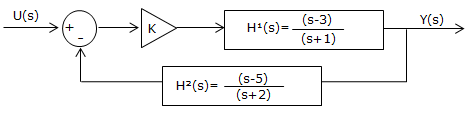
Consider the system represented by the block diagram and its Nyquist plot:
From the Nyquist plot, determine the interval of values K for the system to be stable.
Observe that this exercise refers to the same system of exercise 1 in the Root Locus Method Simulator Object. Compare the results obtained using both methods.